
In brief
There are two types of client experience (CX) metric – leading and lagging ones – and this article focuses on the 3 lagging indicators. For the investment industry, they are ‘buying’ (sales conversion), ‘staying’ (client retention), and ‘buying more’ (products-per-client).
These client behaviors involve transfers of money, which makes them dollarizable. They – and only they – pay the bills. If they point the wrong way for too long, the situation could become life-threatening for the organization, which makes them a vital component of asset management business intelligence.
Use the CX Benchmark to monitor them and calculate the impact to your revenue on your out and underperformance.
The dollarizable CX metrics and how to measure them
“What is more important than whether or not clients buy, stay, and buy more?”
A Distribution COO.
Most client behaviors are not dollarizable. For example, web engagement, podcast streams, video viewings, event attendance, or meeting volumes.
These forms of engagement are important metrics because they are leading indicators that you can stimulate directly.
But no money changes hands during these activities, so you cannot assign a monetary value to them. Instead, they involve ‘Gifts of Time’ so we measure them via the seconds, minutes, and hours that clients give to engaging with your firm at different points along your client journey.
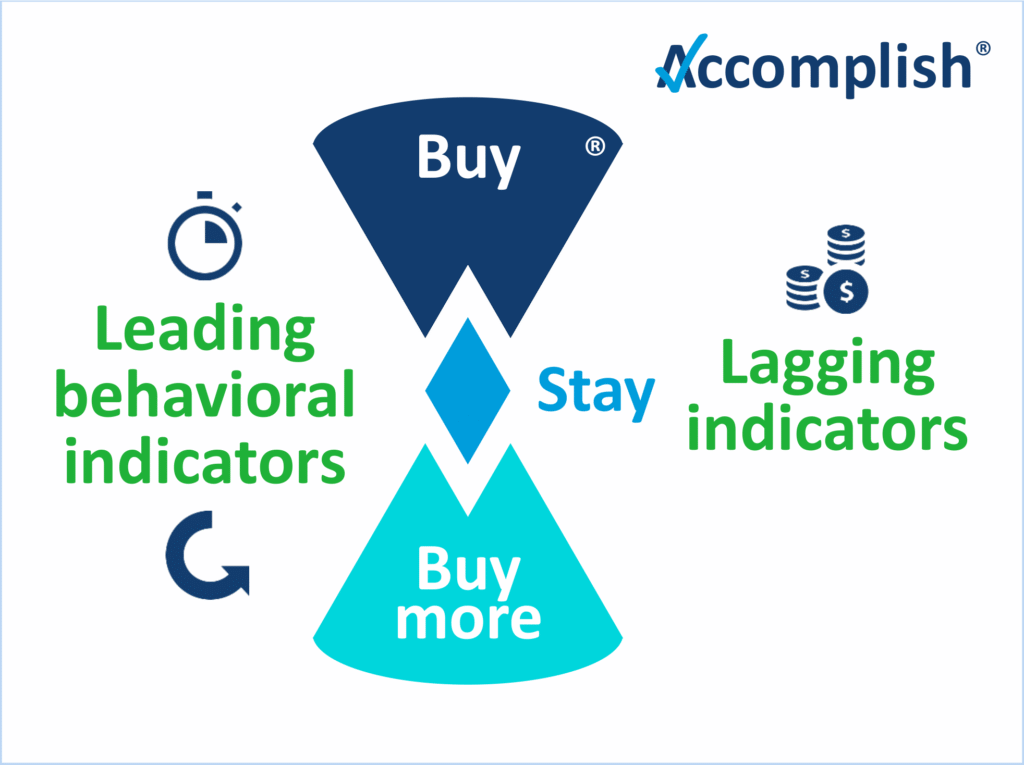
In contrast, 3 lagging behavioral indicators will indicate your success at getting clients to buy, stay, and buy more. Because they involve transfers of money, they are dollarizable, so they – and only they – will pay the bills. Crucially, however, you cannot stimulate them directly – only indirectly through the leading indicators.
Let’s define these most valuable elements of asset management business intelligence and what they will tell you:
- Buying (sales conversion) – B2B asset managers can measure sales conversion in two ways: the percentage, 1) of all the pitches that you won and, 2) of RFP successes that you converted into wins. The first will tell you the strength of your sales capability and let you evaluate the performance of different salespeople. The second minus the first will show the value of your RFP process, which should be positive and exceed its own costs.
- Staying (client tenure) – we measure client tenure through the average length in months of all your client relationships. While winning new clients (incremental revenue) is cause for celebration, client tenure will show you how effectively you retained your total revenue. That alone makes client tenure a vital metric, but relationship managers who track it also rarely take their clients for granted because they have an incentive to retain them.
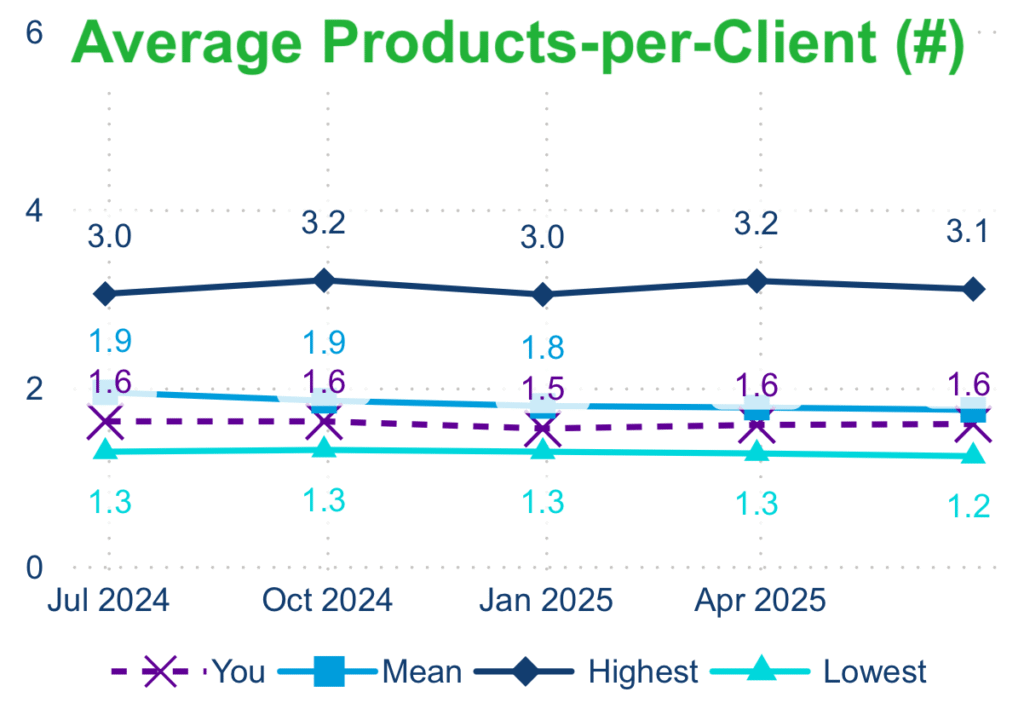
- Buying more (product-per-client) – the best way to keep a client is to deepen your relationship with them, and study after study has found that it will cost you materially more to win a new client than to sell to your existing ones.
Case studies: valuable insights drive informed decisions
The CX Benchmark has calculators that let firms quantify the impact to their revenue of their out or underperformance against these metrics.
This focuses minds and places other priorities in perspective.
As one of Accomplish’s benchmarking clients said on stage in 2023, “what is more important than whether or not clients buy, stay, and buy more?”
With that in mind, here are three case studies to show you the dollarizable CX metrics in actions:
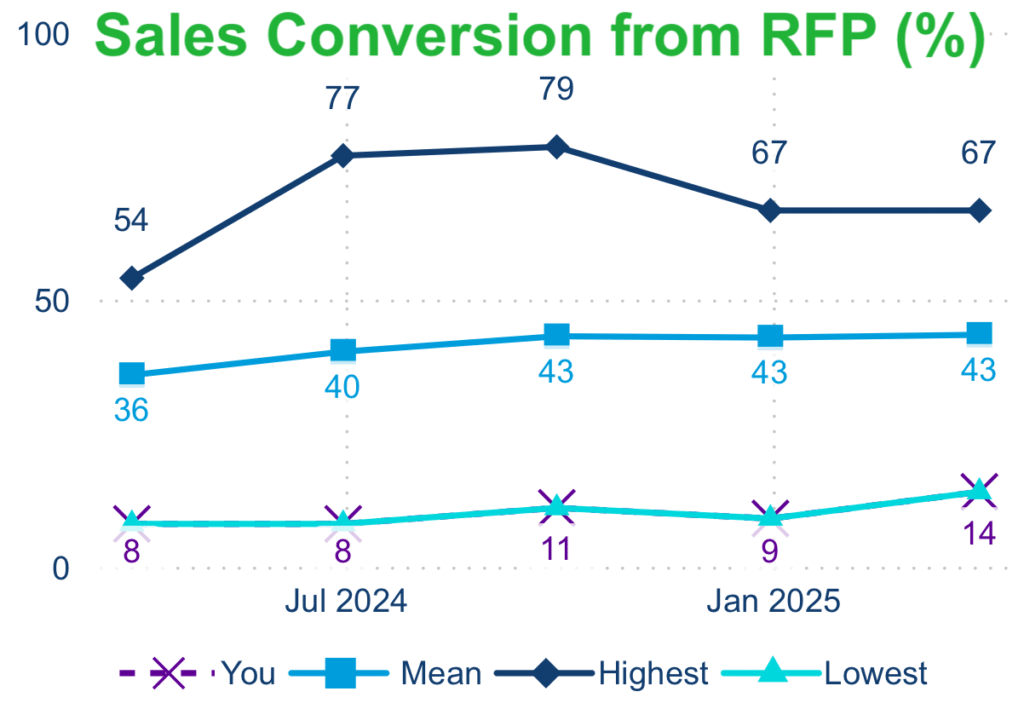
Case study 1: buying behavior (sales conversion)
Leading and lagging indicators – RFPs are a leading indicator of sales and Accomplish unearthed underperforming RFP success and sales conversion rate. In short, the combination represented a “high ‘no, thank you’ rate.”
Action – the firm’s first step was to tighten its RFP selection criteria to invest its resources in a more homogenous sales pipeline.
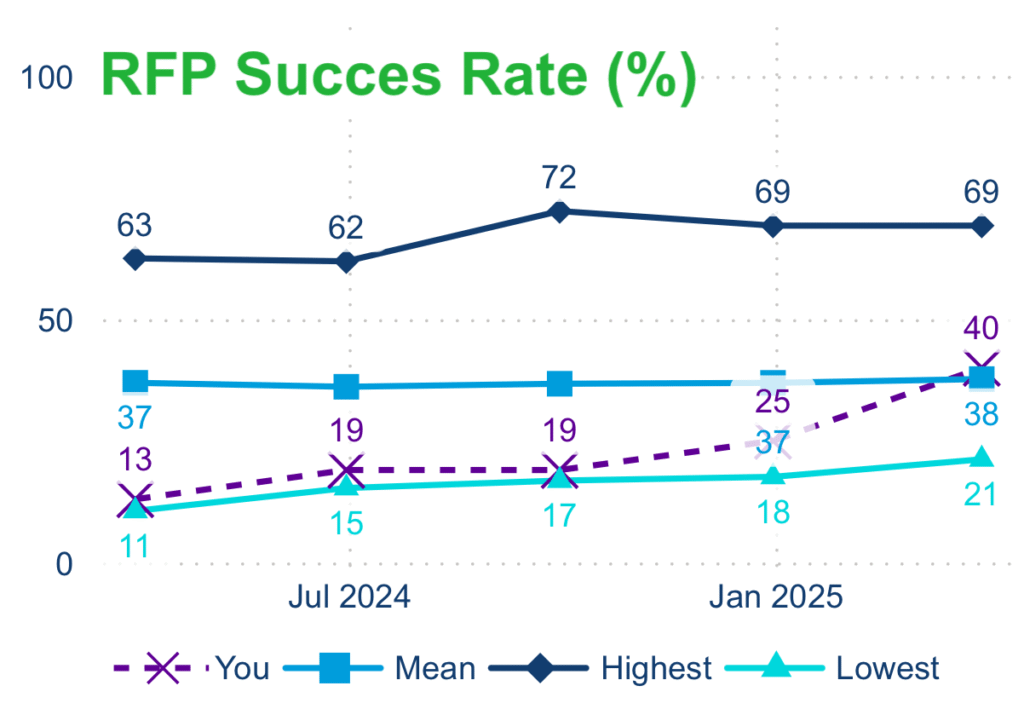
Value – in response, their RFP success rate rose, feeding more opportunities into their sales capability. Will it now flow through into sales conversion, or will they need to act there too? Time will tell, but this granular level of asset management business intelligence allows distribution leads to dissect the sales funnel and apply laser-focused treatments that ensure it stays as wide as possible for as long as possible.
Case study 2: staying (client tenure)
Lagging indicator – this firm’s average client tenure is optimal.
Accomplish’s hypothesis – every 3 months, average tenure rises by 3 months, but this firm’s is staying level, so it must be consistently diluting that rise with new sales: ‘young’ relationships are pulling the average back down and that’s a good thing.
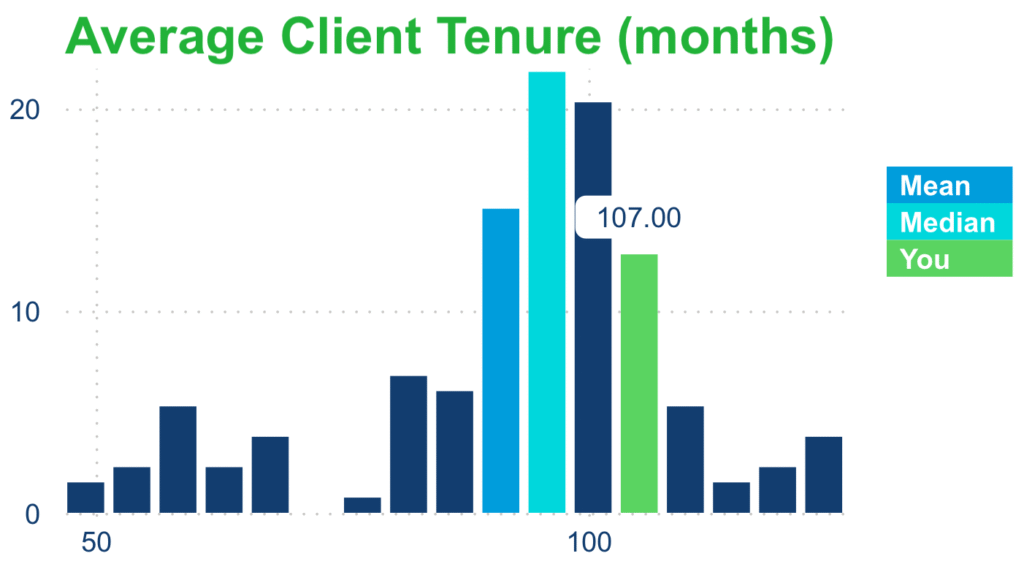
Accomplish’s recommended action – 1) reward the relationship managers, and 2) remind them to avoid allowing a score that is too high (reliance on old relationships) or too low (clients leaving too early).
Case study 3: buying more (cross-selling)
Leading and lagging indicators – this firm has high sales conversion but a low product-per-client ratio. Client meeting volumes are also low.
Accomplish’s hypothesis – sales staff were focusing on new prospects (more costly for the firm) at the expense of deepening existing relationships (lower cost of sale).
Accomplish’s recommended action – calculate the impact of this underperformance on revenue and consider cross-selling targets and client retention plans.
Leveraging dollarizable asset management business intelligence
The CX Benchmark lets you discover where your CX is helping – or hurting – your bottom line. This is important because if your CX underperforms at engaging clients, they will give their time to your competitors … and then their money.
Specifically, the CX Benchmark lets you leverage these insights on three levels:

1. The CX Scorecard gives you the board-level data and metrics needed to a) track the effectiveness of your CX as a high-level differentiation strategy, b) see your hot spots ‘at a glance,’ and if applicable c) comply with the UK’s Consumer Duty.
2. Drill through to your Client Journey that pinpoints, in time and money, where your pre- and post-sale client experience out and under-performed.
3. Lastly, drill through again to detailed analytics per client behavior (like the ones we have explored above): interactive visualizations, use cases and owners, customized insights, estimated revenue impact, bespoke insights and recommended actions.
3 steps to CX excellence
Not all asset management business intelligence is equal, so we hope you found this article useful in demonstrating the unique value the CX Benchmark yields.
As one client put it, “Accomplish has created extreme value by codifying and quantifying the sales funnel.”
Learn more about the CX Benchmark here and then take Accomplish’s 3 steps to CX excellence:
- Book a personal tour of the Benchmark.
- Check the readiness of your CX data.
- Discover, in time and money, where your CX out and underperforms at engaging clients.
Frequently asked questions
1. What does “dollarizable” mean in asset management business intelligence?
Dollarizable metrics are client behaviours that directly involve transfers of money, such as buying, staying, and buying more, which impact revenue.
2. What are the three dollarizable client experience (CX) metrics?
They are buying (sales conversion), staying (client tenure/retention), and buying more (products-per-client or cross-selling).
3. How do dollarizable metrics differ from leading indicators like meetings or web engagement?
Leading indicators show engagement, which you can influence directly but no money changes hands, whereas dollarizable metrics reflect financial outcomes (lagging indicators) but you cannot influence them directly, only through the leading indicators.
4. Why are dollarizable metrics critical for asset managers?
Because they determine whether the firm actually generates and retains revenue; without positive trends in buying, staying, and buying more, the business is at risk.
5. How can firms measure “buying” in asset management?
By tracking the percentage of pitches won and RFP conversions, which reveal sales strength and the effectiveness of the RFP process.
6. How do you calculate client tenure (“staying”)?
By averaging the length of client relationships in months, which shows how effectively a firm retains its total revenue.
7. What is the best way to measure “buying more”?
By tracking the average number of products per client, a reliable indicator of relationship depth and cross-selling success.
8. How does the CX Benchmark help asset managers?
It quantifies the revenue impact of underperformance, provides a board-level scorecard, and drills down into client journey data to show where the firm’s CX helps or hurts.
9. Can leading indicators still be useful if they are not dollarizable?
Yes – they can be stimulated directly and often explain why lagging indicators (buy, stay, buy more) succeed or fail.
10. What first steps should firms take to improve their dollarizable metrics?
Book a tour of the CX Benchmark, check data readiness, and then use the Benchmark to discover where their CX underperforms in terms of time and money.


