

In brief
At Accomplish, we believe the asset management quarterly business review (QBR) will replace the annual distribution strategy because it lets you keep pace with the speed of change in today’s markets.
To adapt more effectively than your competitors we believe your QBR needs to balance sufficient rigor with an ‘essentials-only’ approach.
To achieve this, we propose an agile distribution strategy model for institutional professionals that incorporates vital lessons fighter pilots have learned about battling for supremacy in high-stakes situations. We hope you find it useful.
The annual distribution strategy has had its day
Annual strategy planning has long been ill-suited to an industry like asset management that is constantly impacted by external events, some of which the fund managers will not have predicted. Since the 1980s heyday of the annual strategy plan, the pace of change in the macro environment has increased so much that it is now common for them to be out of date long before they are due their next revision.
In response, distribution teams need to execute unforeseen near-term campaigns that may or may not be consistent with the long-term strategy. These can divert resources away from the previously stated plan and, to exacerbate the situation, the investment industry’s high staff turnover can make each annual strategy event feel like a one-off when instead you should seek continuity and momentum.
Because of this, we believe the less frequent and more rigid annual distribution strategy needs to adapt and be nimbler and more flexible. The solution, we believe, is that the annual strategy will evolve into a faster and more flexible QBR. However, the assumption here is that your QBR is effective and not just a ‘talking shop’. The purpose of this R&D, therefore, is to outline a template for an effective and sustainable asset management quarterly business review.
The winners will operate and adapt faster than the losers
We have heard from DWS that “the golden decade for asset management is over,” and from GSAM that “asset managers need to work harder and be even more innovative.” If the easy times are over, how can firms ensure they will be one of the winners in this high-stakes situation?
At Accomplish, we believe asset managers can learn vital lessons from military fighter pilots. The US Air Force’s John Boyd captured these findings in his OODA Loop. His credentials? ‘40-second Boyd’ was renowned for being able to win any aerial battle in less than 40 seconds.
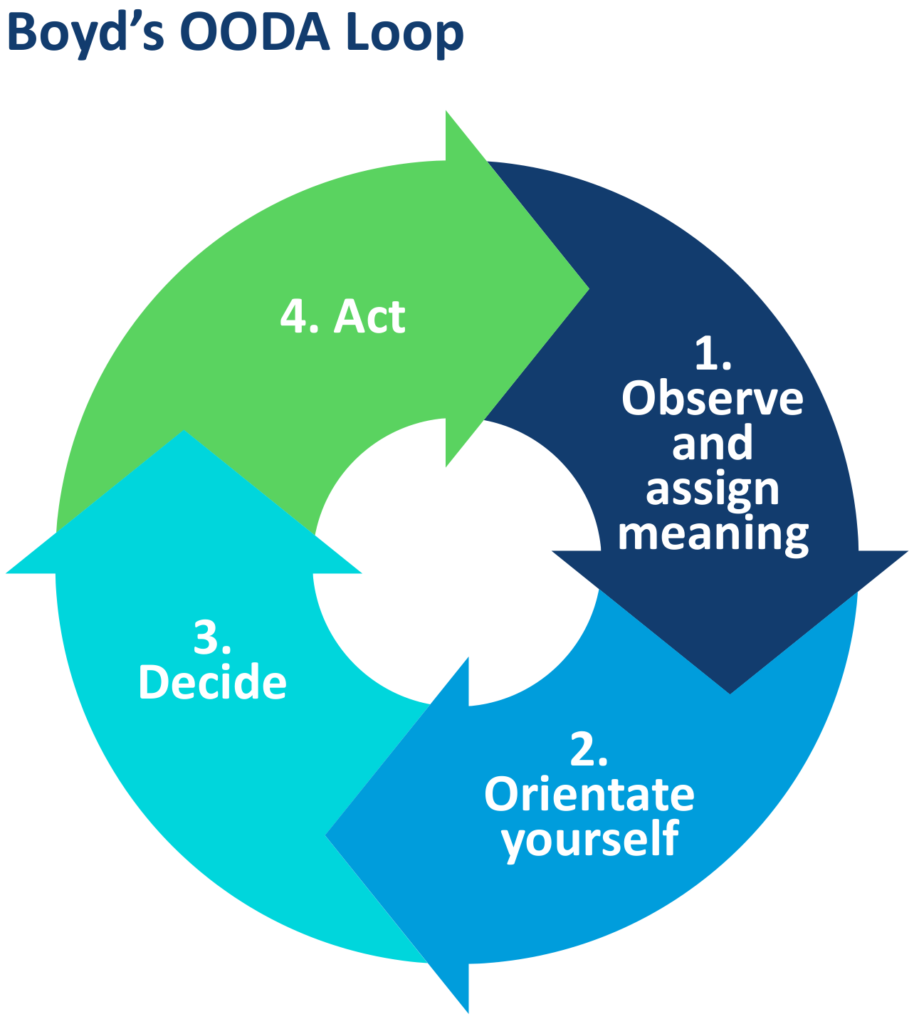
The trick to his success? Boyd’s OODA Loop is a constantly repeating four-step decision-making cycle: 1) observe and assign meaning, 2) orientate yourself, 3) decide, and 4) act. Those who prevail are the ones who complete it quickest and most effectively.
- Observe and assign meaning – build the most accurate and comprehensive picture possible of your situation and don’t just look at the information, assign meaning to it.
- Orientate yourself – Boyd found trainees would often overlook this step thinking they already knew the answer from a prior experience, yet he maintained that it can be enough to overcome an initial disadvantage. His advice: connect with reality by placing your observations in their broader context. This lets you see the world as it really is, free from your cognitive biases, shortcuts, and emotional responses.
- Decide – create an informed hypothesis, test it, spot and remediate its flaws, and keep iterating.
- Act – execution is everything, so now act without delay.
The result is a learnable framework for operating at a faster tempo than an adversary, and every time you complete a cycle you get better at it. Conversely, in Boyd’s experience, those who respond too slowly (because they have a long and slow OODA loop like the outside lane on an athletics track) become disoriented as you operate “inside their OODA loop”, creating surprise and confusion that disables them further.
A template asset management quarterly business review
To help you become an asset management equivalent of 40-second Boyd we have developed a QBR template that you can customize to your organization. It aims to meet two criteria: to incorporate the rigor of the OODA Loop while maintaining an ‘essentials-only’ approach.
Because of this, I will be the first to admit that you could add more to it, but bear in mind you will need to do this four times a year, so avoid taking on too much. I also don’t believe there is anything ground-breaking here, just keep it simple so you engage your stakeholders and keep them engaged each quarter: smothering yourself in too much data is an easy way to disorientate yourself and your colleagues when you need to achieve the opposite.
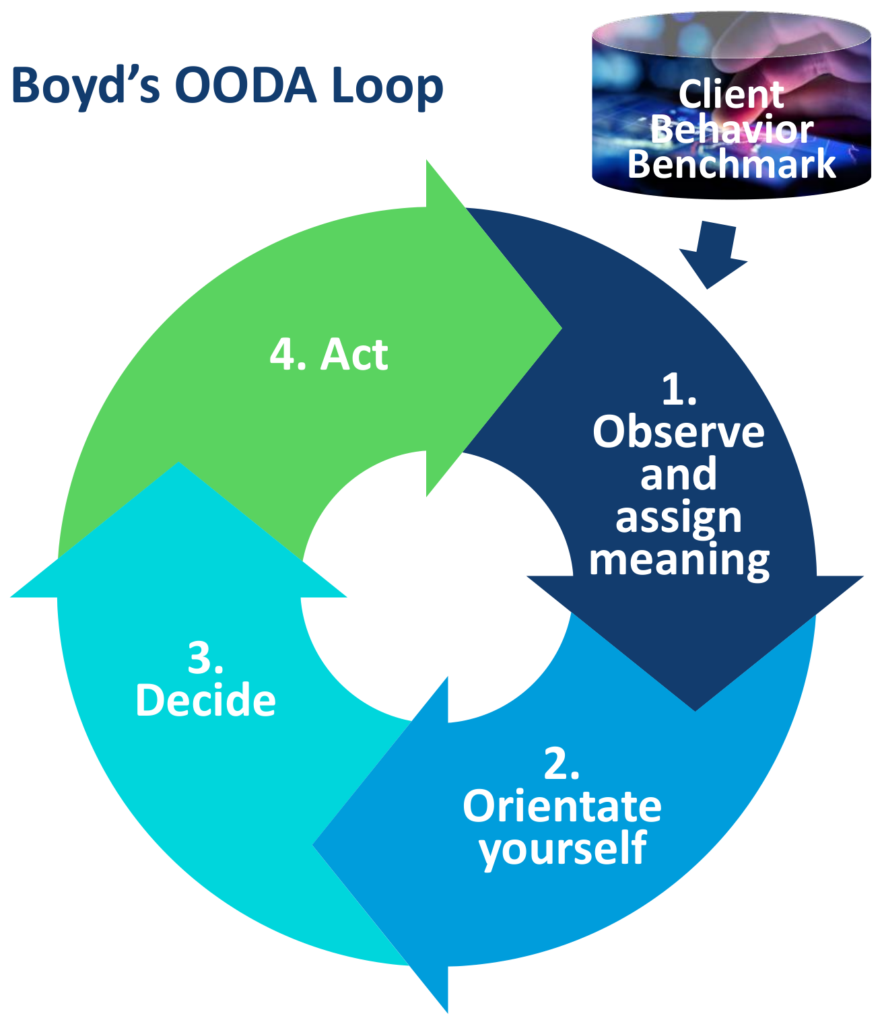
You will, however, need to take data from different sources for different steps. The Client Behavior Benchmark has been purpose-built to fulfil the needs of Step 1.
Step 1. Observe and assign meaning
How are you progressing towards your targets? At a minimum, they should include your goals for getting clients to buy (sales conversion), stay (client retention) and buy more (relationship depth). These are strategic and dollarizable client behaviors that are vital inputs as you observe and make sense of your environment – you can measure, compare, and predict them through the Client Behavior Benchmark. Remembering that OODA is a cycle, you will have set your targets in Step 3 of your previous QBR so, at your first session, just review this data so your colleagues and you align on whether you consider it favorable.
How did you make it happen? Remembering that your sales funnel is actually Hourglass-shaped, review your out- and underperformance across its end-to-end to highlight where you are leaking clients in abnormal proportions relative to your competitors.In particular, we recommend tracking ‘Gift of Time’ metrics that unearth the time clients and prospects give to your firm compared to other asset managers. For example, how do your conversion rates compare: from emails to web visit lengths, or from time spent on thought leadership to event attendance and meeting volumes? And how do these findings explain your progress towards your targets?
What external events will impact demand? Summarise key developments in the macro environment, your hypotheses of how they will impact demand, and what they would mean to your organization.
What feedback have clients given? Voice of the client data is typically available less frequently than quarterly, so include it when it is available accompanied by an assessment of what it implies.
Step 2. Orientate yourself
What cards do you hold right now? If you will let me mix my analogies for a moment, I’m a bit of an amateur card player and over the years I’ve learned the importance of playing the cards I’ve been dealt, not ones I wished I had.
So, use a simplified single supply:demand chart (or even a matrix) to identify the asset classes you manage that are currently meeting market demand. On one axis, plot your 1- or 3-year performance. On the other, plot whether demand is positive, neutral, or negative. Then categorise them as to whether you should therefore be on the offensive, defensive, or neutral. After a few periods, trend lines will also appear in the variables.
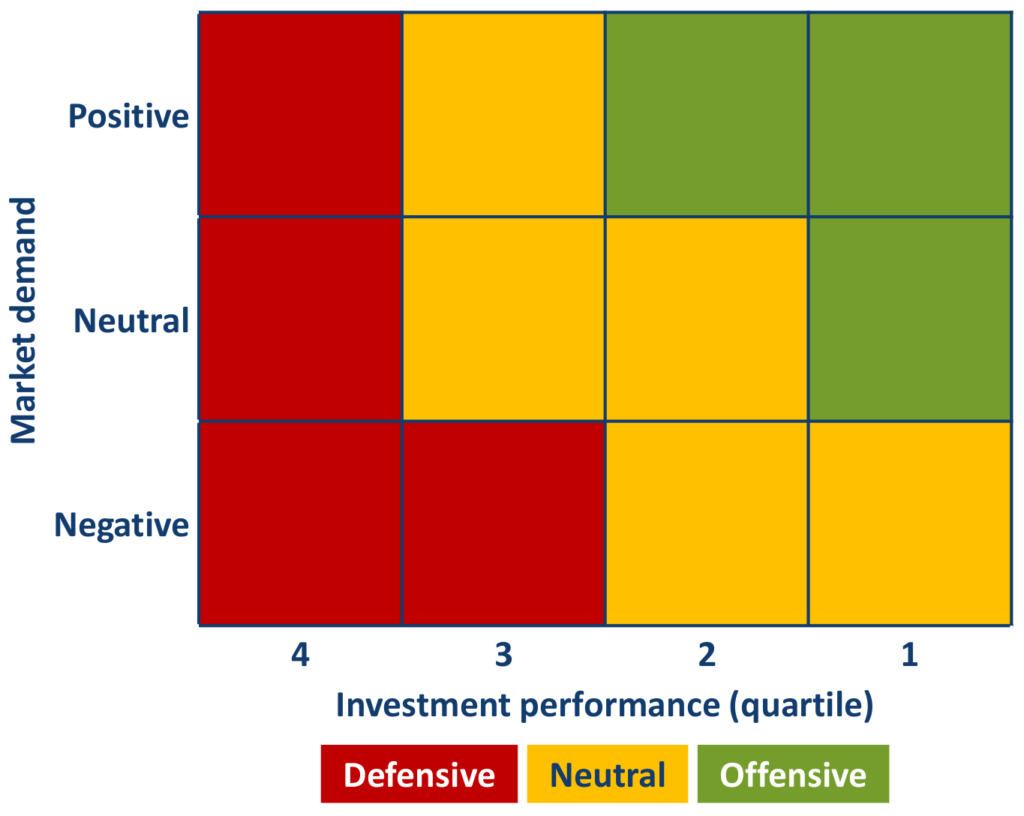
Where performance and demand are both positive you should be on the offensive: sell, upsell and cross-sell. Where the opposite is the case, you should be on the defensive stance characterised by pre-emptive messaging and client retention plans.
What effect do you want to create? Set the targets that you will review in Step 1 of your next QBR. To emphasise, at the very least, we recommend you focus on whether or not clients are buying, staying, and buying more from you, as well as on your relative effect on these strategic and dollarizable client behaviors compared to other asset managers. Measuring without comparing is insufficient: to prevail, you must know your effect relative to your competitors. Put differently, comparing yourself against yourself is the wrong answer: it would be like a pilot defining success as firing more missiles than they did in the previous fight, which would be wasteful and unlikely to be effective. If the average pilot hits their target X% of the time, you simply must set yourself a target of greater than X%. If you do not, your idea of good may not be good enough. Granted, we manage the Client Behavior Benchmark that provides these insights, but we do so to serve asset managers’ need for this vital business intelligence.
What do your clients and prospects need to hear from you? In a knowledge industry driven by digital content, you need to be talking about what concerns and interests your clients. So, to achieve your targets, what key messages do you need to promulgate? For example, you have a plan for this, you have fixed that, and launched the other. Macro events and your latest investment performance will change their concerns, so don’t waste time by trying to do this too far in advance. Better to identify long-term general themes and re-set your content calendar quarterly to support your latest assessment of where you need to be on the offensive and defensive.
Step 3. Decide
What are your options? Translate your findings into the simplest of frameworks to hypothesize potential actions while also overcoming any emotional attachment to prior plans and blind spots:
- Stop – what did not work and should be re-evaluated or avoided in future?
- Start – what did you not do that you should start doing?
- Continue – what worked and should be repeated or even expanded?
Select your best options – in Accomplish, our preferred methods for sifting out sub-optimal ideas are to score them (Y/N) for their suitability, feasibility, and acceptability, to map them against targets, and to dollarize their expected ROI.
Step 4. Act
Basics, basics, basics – who will do what and by when? If something is not that simple, who are you putting in charge and what resources are you assigning to them? And how will you track actions to their completion?
At this point, move back to Step 1, look out of the cockpit again, and observe what’s going on out there. At any time between QBRs, jump back into the Client Behavior Benchmark to interpret the new things you see. This ongoing engagement with the benchmark is the equivalent of keeping your eyes up and making sense of new developments.
Now get inside their OODA loops!
The early mover asset managers have already incorporated the Client Behavior Benchmark into their QBRs, making them nimbler and more responsive to external events.
If this template asset management quarterly business review could help your firm catch up, check out the benchmark, download a brochure, and book a demo.
We wish you all the best as you get inside your competitors’ OODA loops.

