
In brief
In September 2023, Accomplish unveiled the Client Behavior Benchmark at DCE Connect – the annual invite-only asset management client engagement conference for MDs and senior managers.
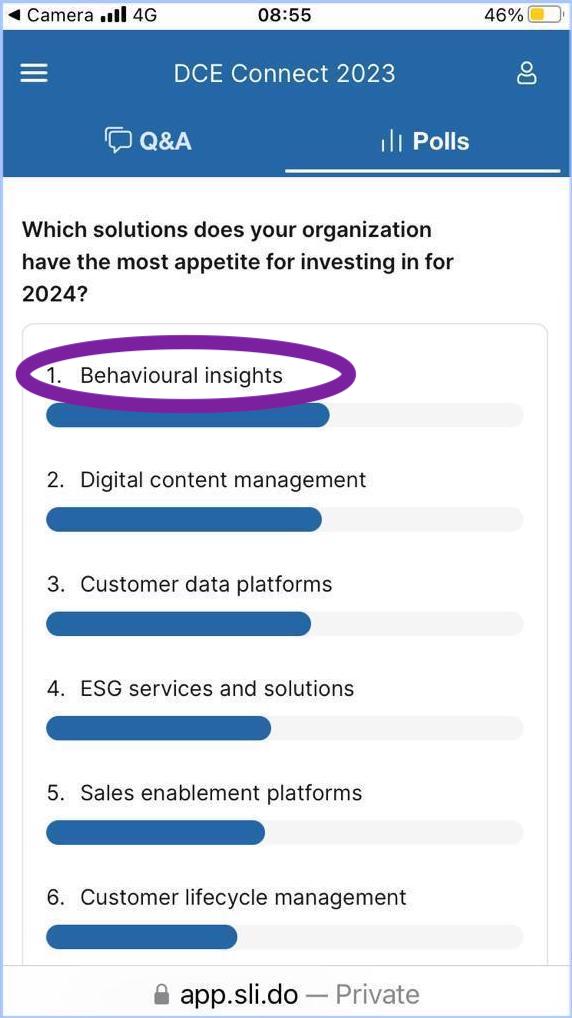
In a keynote speech, Adam Grainger explained how to measure client engagement, demonstrated how the benchmark is helping investment firms keep their sales funnel as wide as possible for as long as possible – and the data is already in your systems. On completion of the conference, attendees placed behavioral insights at the top of their list of 2024 investments.
Here is a short demo of the benchmark. You can also click to watch the full speech (including audience questions and answers), download the slides, or read on for the transcript.
What is the definition of ‘client engagement’?
This is a conference dedicated to digital client engagement, so let’s check we’re all aligned on what engagement is.
1. Client engagement is behavior
According to Dictionary.com, it is the ‘act’ of engaging or having done so. Engagement, therefore, is a type of behavior.
But the behavior of your clients (what they do) is only one way the experience you provide affects them. The other way is in what they say, which we call feedback, and which assesses their level of satisfaction
So, why do we have a conference on engagement but not one on satisfaction? Satisfaction is an ‘opinion’, which the dictionary defines as being a personal appraisal – “you’re very good” … “5*s”. But it also reminds us that opinions rest on uncertain grounds. And this is because they are not consistently definable: “very good” will mean different things to different people, and so will “5*s”.

Humans are also tricky creatures: when we give feedback, we forget less recent events, we avoid difficult conversations, and we say one thing and do another. So, while you may want to find out your clients’ satisfaction levels, even in their interests, don’t rely fully on the output because it will contain gaps and inaccuracies.
In contrast, you can consistently define, observe, and measure behavior. That’s important because this entire conference is dedicated to successful asset management client engagement, so you will want to measure it to know when you have achieved it. And because engagement is a behavior, you can do that with considerable accuracy.
2. Client engagement is a means to an end
Different firms will set different targets, but they will almost certainly involve stimulating buying behaviors in clients. But from a behavioral perspective, you need more because, for example, it doesn’t make much sense to bring them in the front door if they’re just going to leave via the back door. Revenue from retaining existing clients will almost always far exceed the additional income of recent wins.
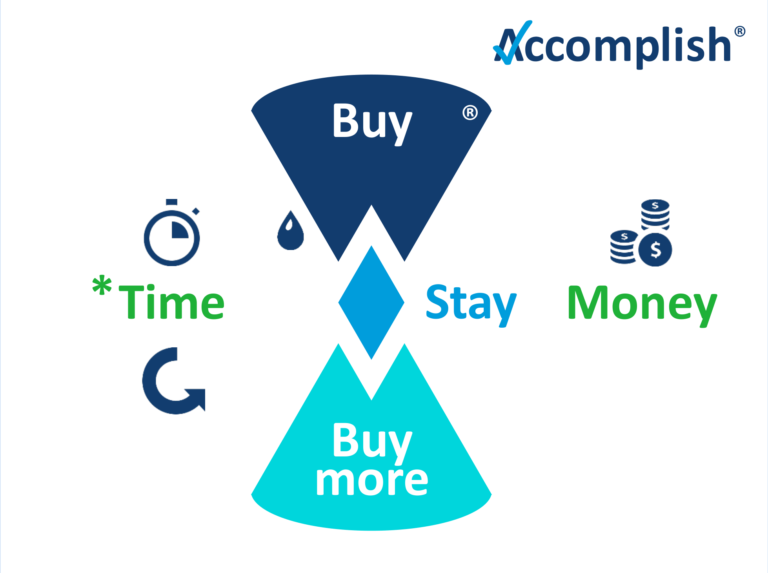
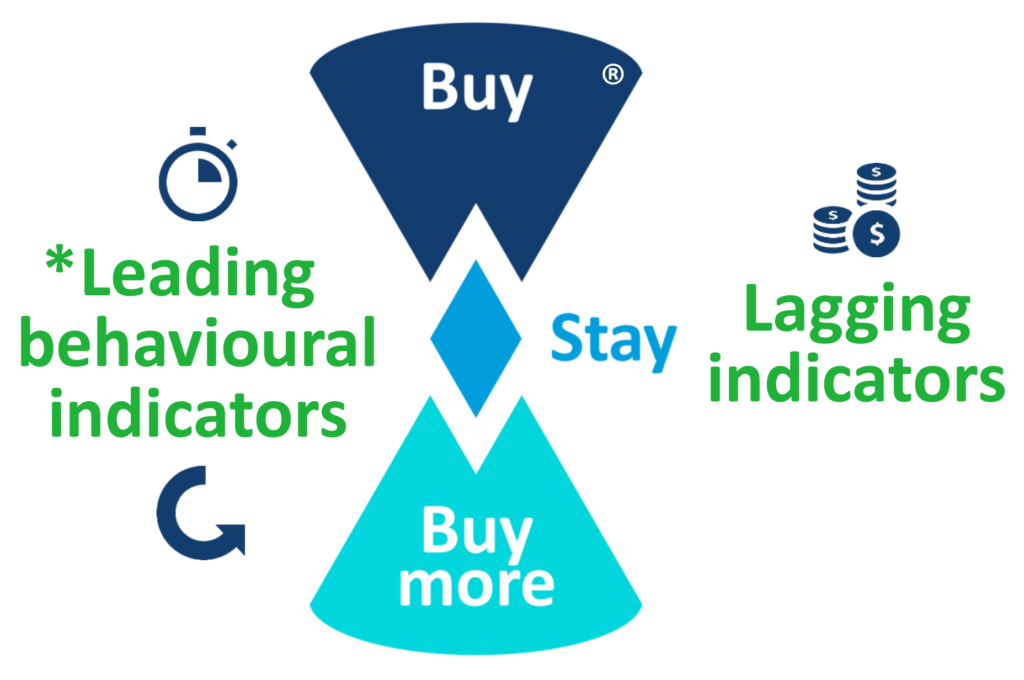
Lagging behavioral indicators – so, what are the strategic client behaviors that we believe you should target? We think you need them to buy, stay, and buy more, because, frankly, this balance is what a relationship business needs to stay in existence.
Translating this into business speak, you want to convert prospects into sales, retain clients so you get a reliable revenue stream, and increase your product-per-client ratio so you can be more useful to them, and they can be more useful to you increasing even more the chance they stay with you.
These are lagging indicators that clients have bought, stayed, and bought more. They are the strategic behaviors, and they are dollarizable because they involve the transfer of money.
However, the problem with any lagging indicator is that you cannot stimulate it directly: you cannot just invite yourself to pitch for a second mandate. You need to do more.
Leading behavioral indicators – that’s where client engagement and the leading behavioral indicators come in. Digital ones include email open and click rates, thought leadership visit times, webinar viewings, podcast listens, and client portal logins. Non-digital ones include event attendance, meeting requests, and RFP requests.
Together, they signal potential demand. And where lagging indicators involve transfers of money, leading indicators involve gifts of time, because behaviors take time to perform. As a result, they are the things that make up your client journeys and you will use various combinations of them to boost your lagging indicators.
This is because leading indicators are still to be played for, so you can stimulate them, thereby using them as an indirect route to your goal. For example, you might bring about that request to pitch for a second mandate through email marketing, thought leadership, webinars, etc.
And that makes the leading indicators of asset management client engagement the essential means to an end.
3. Client engagement is relative
Asset managers are all in a zero-sum game with each other competing for client engagement. This is because in the same way as there is only so much money they can allocate to you, there is also only so much time they can give.
So, whatever time your firm receives will be an opportunity cost for your competitors, and vice versa.
This is important because, while you may know your hottest leads because they gave more time to your brand than your other leads, unless you also know how much time they gave to your competitors, it might be that they are actually hotter for someone else. Engagement, therefore, is relative.
Putting asset management client engagement to work
If engagement is behavior, then you should stimulate it because anyone has the power to do that. You can convert one behavior into another through ‘calls-to-action’ (CTAs) and nudges. In so doing, you ease a client’s progress through the journey you have prepared for them. This is important because the more you try different CTAs and nudges, the better you will get at them, and the fewer clients that will ‘leak’ from your sales funnel meaning that you will keep it wider for longer.
If engagement is a means to an end, then it is logical to stimulate the leading indicators because they have not yet happened and will boost your vital lagging indicators.
If engagement is relative then, through comparison, you can discover your out- and underperformance at stimulating clients to give you their time and money. If through it, you discover an underperforming point on your client journey, you can practice and improve the way you facilitate a client’s progress through it until you start to outperform your competitors. In so doing, you will keep your sales funnel wider than them.
The Client Behavior Benchmark
In a moment, I’ll demonstrate how you can use something called the Client Behavior Benchmark to keep your sales funnel as wide as possible for as long as possible.
But, briefly before that, the reason we wanted to sponsor this event is because we wanted you to know about the benchmark. It was built through an industry-wide R&D initiative to which >150 SMEs contributed from around the global industry. And it is relevant to any discussion about asset management client engagement because:
- It measures client behavior.
- It differentiates between leading and lagging indicators.
- It will show you your out- and underperformance across the client journey.
With it, you can now measure the performance of your client engagement and use that information to manage your effect on whether clients buy, stay, and buy more.
Measure asset management client engagement
So, let’s take a look … here is one of three ways you can interact with the dataset. We call it the Quarterly Business Review (QBR) because it was designed to be an insert into a quarterly review of distribution strategy.
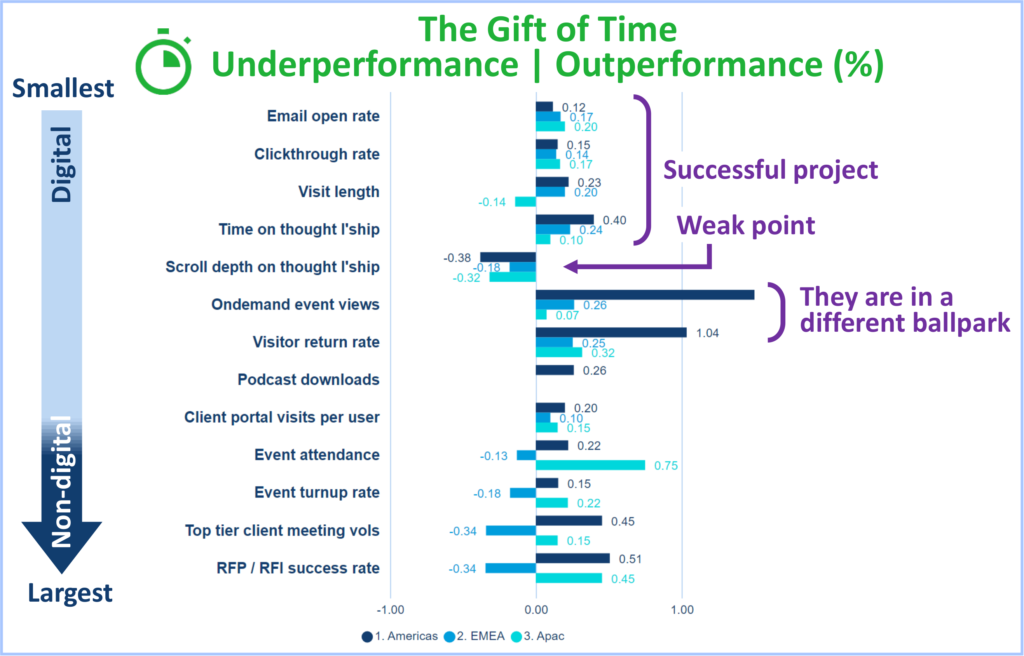
This is the first half of the QBR, which covers the leading indicators on your sales funnel that involve a gift of time – from smallest to largest and covering both digital and non-digital behaviors. This firm is a global organization with three regional businesses: Americas, EMEA, and Apac.
The chart shows variance in % against the benchmark for each client behavior in each region, so they can see where they’ve outperformed (to the right) and underperformed (to the left) against other firms and their colleagues in different regions.
What sort of insights would we raise with this demo firm? First, their recent email marketing project worked and is now outperforming at driving users to their site where they’re staying longer than average. So that early part of their client experience appears to be working well.
Next, we would raise a weak point that relates to the scroll depth on their thought leadership pages, where we can see that users are not scrolling down as deeply on these pages as they are on other firms. What can they do with this information? They can now either change their editorial policy or just move key points and CTAs higher up their web pages.
We then get two metrics where their American business (in dark blue) is just in a completely different ballpark to everyone else in terms of viewing volumes of recorded events and visitor return rates. Both of which, we believe are really valuable leading behavioral indicators. So what? They can now exploit the hell out of this with their most effective and important CTAs and nudges, as well as show their EMEA and Apac colleagues how to do it too.
Keep your sales funnel as wide as possible for as long as possible
As we ‘cross the Rubicon’ from digital to non-digital behaviors the picture starts to change. Broadly speaking, so far, their regional units have moved in the same direction together. Until now.
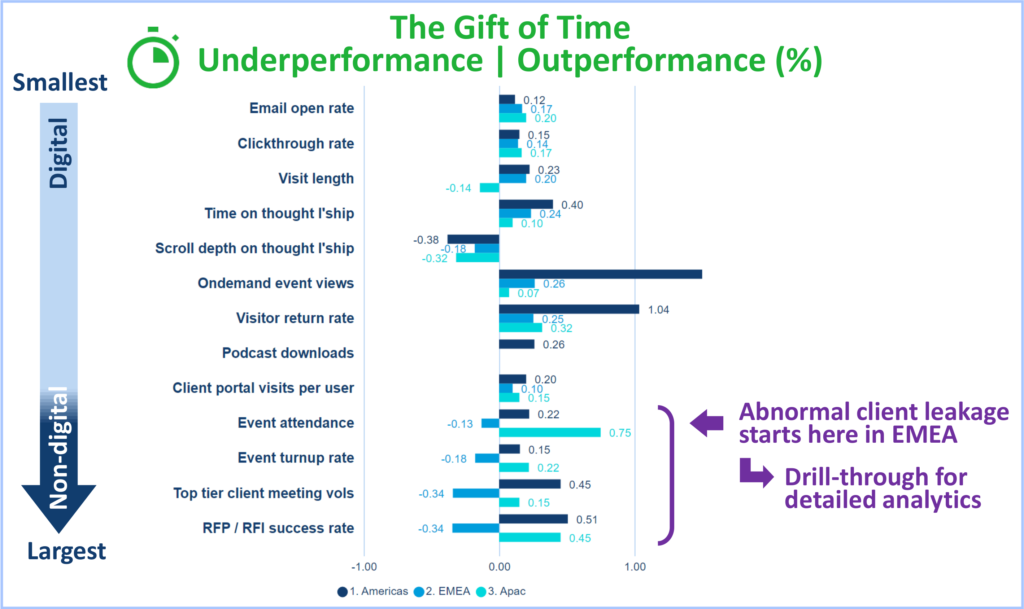
At this point, the American and Asian businesses zig to the right but the EMEA business starts zagging to the left. And in % terms, it’s not good for EMEA. For some reason, it starts underperforming at converting digital engagement into non-digital. Are clients just using them as an online resource? Or are they struggling to integrate marketing activities into sales? They need to investigate.
But the crucial point is that now they know. Now they know that their EMEA sales funnel is leaking clients at an abnormal rate, which means it is narrowing more than their international colleagues and their competitors.
Now they can pinpoint when the problem starts, quantify its extent, and calculate how far they need to turn things around before they outperform their peers again.
Armed with these insights, this becomes a known and entirely solvable problem.
And when they fix it and return to outperformance, they will, by definition, be keeping their sales funnel as wide as possible for as long as possible.
Manage your effect on whether clients buy, stay, and buy more
These were the leading indicators that relate to asset management client engagement so, remembering that it is a means to an end, the second half looks at the lagging indicators. They let you see how your performance in getting time from clients translates on average into money.
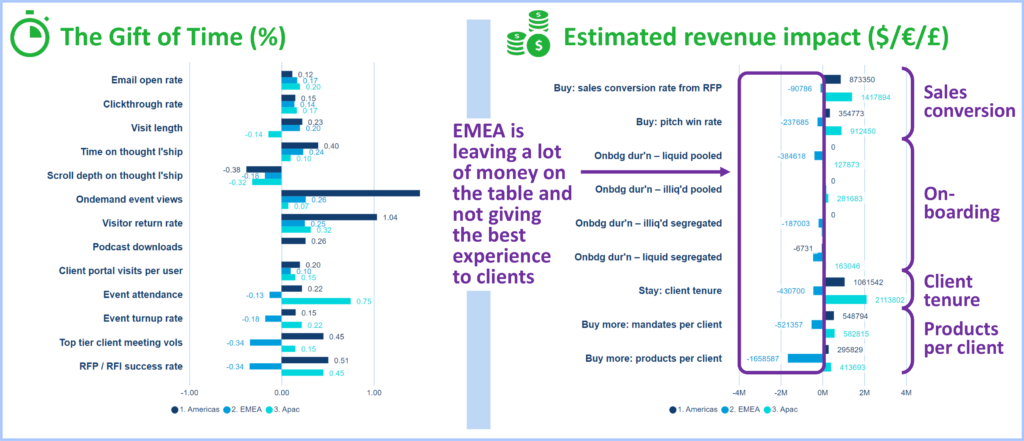
I’m going to stay zoomed out because our conference relates to the leading indicators, and I don’t want to go off topic too much. Also, sometimes it’s helpful to step back from data and describe what you see. This is a super easy demo scenario using the same concept of variance from the average but using currency values (rather than %) and in which EMEA in the medium blue is still our problem child.
What we see is that EMEA is getting clients to buy but is just marginally less successful. It is onboarding them but it takes a little longer to do so. Clients are staying but for less time. And they are coming back for second and third products but in significantly fewer numbers than everyone else. Put simply, EMEA is leaving a lot of money on the table and not giving the best experience to clients. Put simply, EMEA is leaving a lot of money on the table and cannot be giving the best experience to clients because if it was, they would be staying for longer and returning in higher numbers for second and third products.
Quantify the revenue impacts of the behaviors you stimulate in clients
How do we get this data? We take actuals from the benchmark, for example, your pitch win rate vs the benchmark. We create a directionally-accurate estimate by adding an assumed weighted average fee rate, and total pipeline size. And that flags any issues: either strong out- or underperformance.
You, the asset managers, then use a calculator elsewhere in the benchmark to export the calculation and customise it with your confidential actual fee rate and pipeline size. In so doing, we just quantified the revenue impacts of the behaviors you stimulate in clients.
And it’s possible to do this for buying (sales conversion), staying (client tenure), buying more (products-per-client), plus onboarding. The latter is not a client behavior, but it is crucial to client experience, and we can see a lot of money left on the table.
Set targets: sales conversion, client tenure, and products per client.
Lastly, what are they doing with the information? The most important thing they are doing is setting informed targets that balance the front door (sales conversion), the back door (client tenure), and what happens on the inside (products per client).
From our vantage point, therefore, we see a market in which the strong firms will be those who take control of this data that’s already in their systems – because the data you need for this IS already in your systems – and extract actionable insights like this from it.
And the Client Behavior Benchmark was purpose-built for you to do this.
To pull this altogether
You can now measure the relative performance of your client engagement. And you can use this to manage your effect on whether clients buy, stay, and buy more.
And the data’s already in your systems.
Thank you very much for indulging me with your time. I hope you found this session useful. And I would be delighted to take any questions.


